Collecting great data is only the first step.
Next, you need to use it.
Too many teams do regular inspections, and then just let the data . . . sit. Or maybe they look at one metric without probing deeper to get the right insights.
But when you know how to look at the data correctly, you’ll always have a pulse on quality levels within your facilities.
What metrics should I be looking at?
First, look at the key metrics or service level agreement you’ve outlined with your clients or organization. Those should always be your first checks!
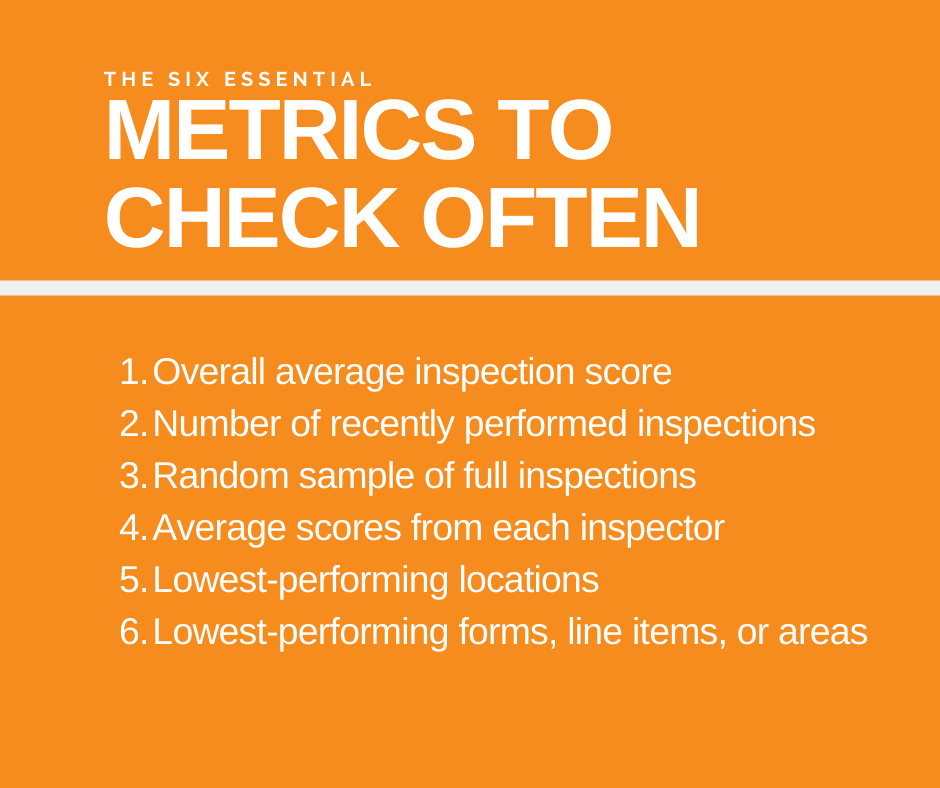
Beyond that, we’ve found these six checks to be key for janitorial and facilities teams:
- Overall average inspection score
- Number of recently performed inspections
- Random review/sampling of recently completed inspections
- Inspectors report
- Lowest-performing locations
- Lowest-performing forms, line items, or areas
We’ll look at these checks two by two and discuss how, when, and why you should be taking a look at each.
Ensure Your Process is Running by Checking These Two High-Level Metrics Daily
The first two metrics we recommend you track are big-picture numbers that will help you ensure that your quality control process is up and running.
The first is your overall average inspection score. (You might set this to the past 30–60 days.)
The second is the number of recently performed inspections. (Again, this might be for the past 30–60 days, or more frequently if you perform a high volume of inspections.)
Keep these two numbers at your fingertips and check them daily. That way, when things start to change, you’ll know right away. If you expect your team to perform a certain number of inspections a week, but that’s not happening, you need to know. Similarly, if your overall performance starts to slip, you want to know . . . and you also want to know if it seems like inspectors are giving everything top scores without really checking.
In short, these numbers help you see that your inspection process is up and running. You’ll get a feel for the normal range when things are running smoothly and know when to investigate changes.
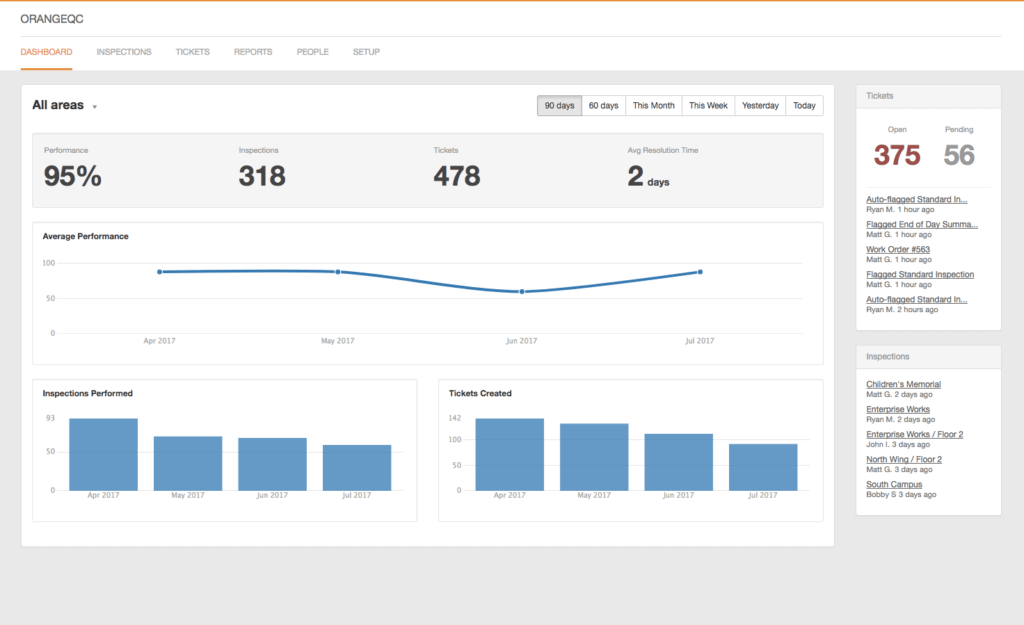
If you’re using OrangeQC’s janitorial inspection software, both of these numbers will greet you right at the top every time you open the site:
Validate You’re Getting Good Data by Reviewing These Two Reports Monthly
If you want to run a data-driven business, you need to be sure the data you’re acting on is good. That’s why we recommend regularly checking these next two reports.
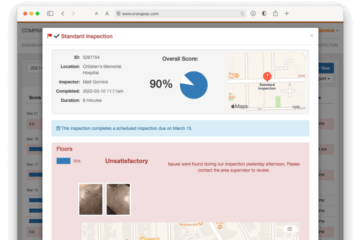
First, a random sample of full inspection reports. This is a spot-check of your inspections. Rather than only reviewing the data in aggregate, you’ll see whether individual inspections are up to scratch or not. Do the timestamps, location, and duration all match up with what you expect? Are there notes on deficient items to clarify the problem?
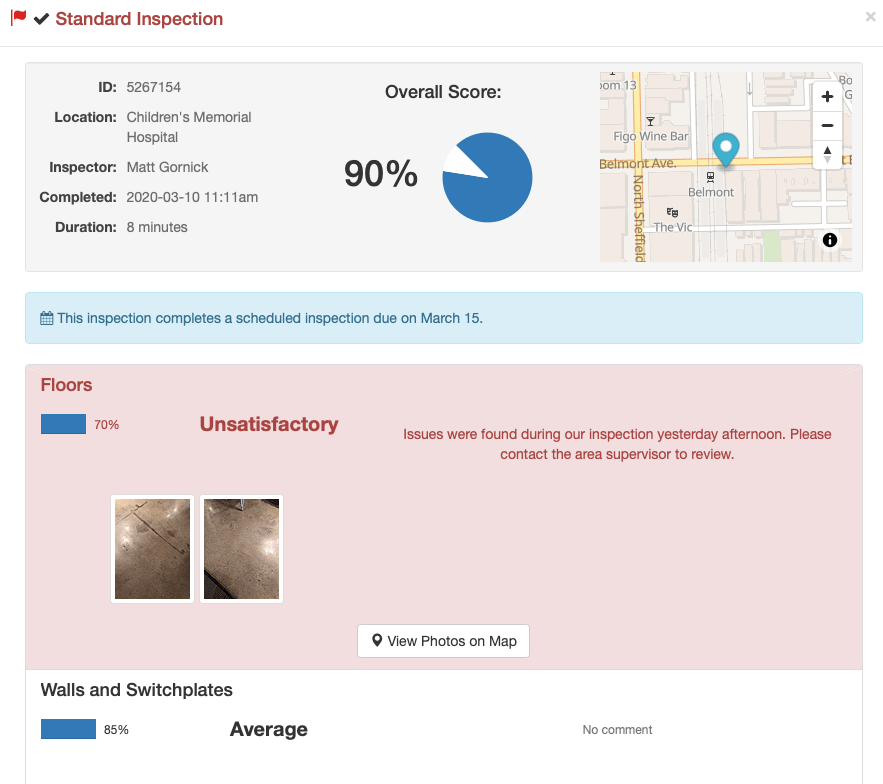
We recommend you do this on a monthly basis, especially if you aren’t regularly reading through full inspections as part of your process already. That way, you can check in with inspectors who aren’t hitting the mark and make sure you’re getting high-quality data. Just scroll through all your inspections and bring up a few to check them out in more depth.
The next report you should check on a monthly basis to ensure great is the inspectors report. This will show you the average scores given by your inspectors over time.
If it’s supposed to be rare that an area gets a perfect score, and you’ve got one inspector constantly giving out 100%s, that tells you there’s a problem. Conversely, if one inspector consistently gives much lower average scores than the others, they might also be off.
Here’s how the report looks if you’re using OrangeQC:
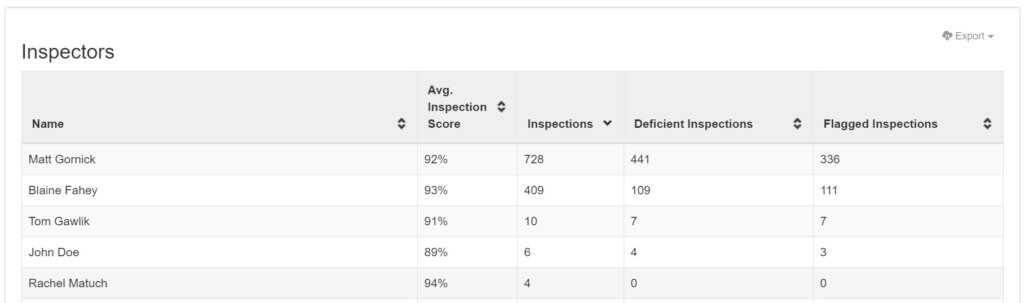
This is an easy spot check that will help ensure your whole team is on the same page about inspection standards and expectations for scoring.
Check These Reports to Hone in on the Right Priorities
Once you know your quality control process is running smoothly and yielding good data, it’s time to use that data. These next two checks will help you hone in on priorities for your team.
The first is your lowest-performing locations. Depending on how your team is organized, this might be a client, building, floor, or other area.
To check how your different areas are scoring in OrangeQC, just bring up the overall report and scroll past the dashboard. You’ll see all of your areas, the number of inspections, and the average inspection score for your chosen time frame.
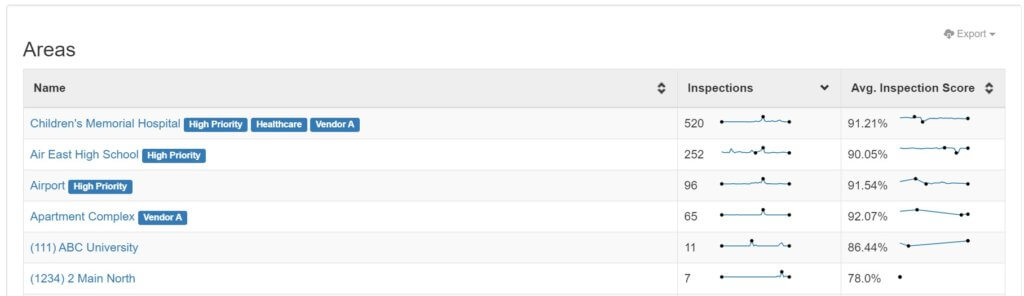
This is a great way to see how things are going at a glance and compare quickly. If you’ve got an area with a score well below average, you’ll want to dive in deeper to see what’s going on.
If you’ve got an area that’s struggling, you know you need to prioritize it. Pay extra attention to ensure you’re delivering the right level of quality. Dig deeper into what’s going wrong.
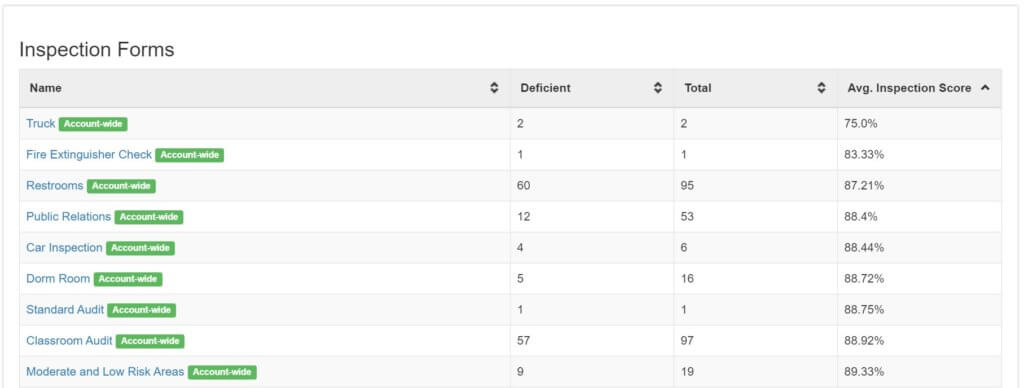
The final report you should check regularly is your lowest-performing forms, line items, or areas. This will clue you in on the steps in your process that need additional attention.
Based on what you see here, you may need to work on training, strengthen communication with the cleaning team, or adjust staffing levels. The more you explore the data, the clearer the problem will become.
And that wraps up the six metrics, reports, and dashboards we recommend you keep a pulse on! Putting these six checks into place will help you run a healthy quality control program.
Of course, your team will want to build on top of this foundation and find the right mix that works for you. You’ll know things are working well when you’re finding out about problems with cleaning quality or employee performance from the reports — and not from your client or organization.
For handy reference, download our PDF checklist of six essential metrics to check regularly. This is a great one to share with your team . . . or print and post as a reminder!
Looking for a tool to perform inspections, see real-time dashboards, and get in-depth reports? You’ll get started on all of the above during your free 30-day trial of OrangeQC.